Bull Flag
Updated How we review
A bull flag is a bullish continuation chart pattern that forms after a strong upward price move (the flagpole), followed by a brief period of downward or sideways consolidation (the flag). The pattern suggests that the preceding uptrend is likely to continue once price breaks above the upper boundary of the flag. Bull flags are characterized by decreasing volume during the consolidation phase and a surge in volume on the breakout. Traders typically measure the target by projecting the length of the flagpole from the breakout point.
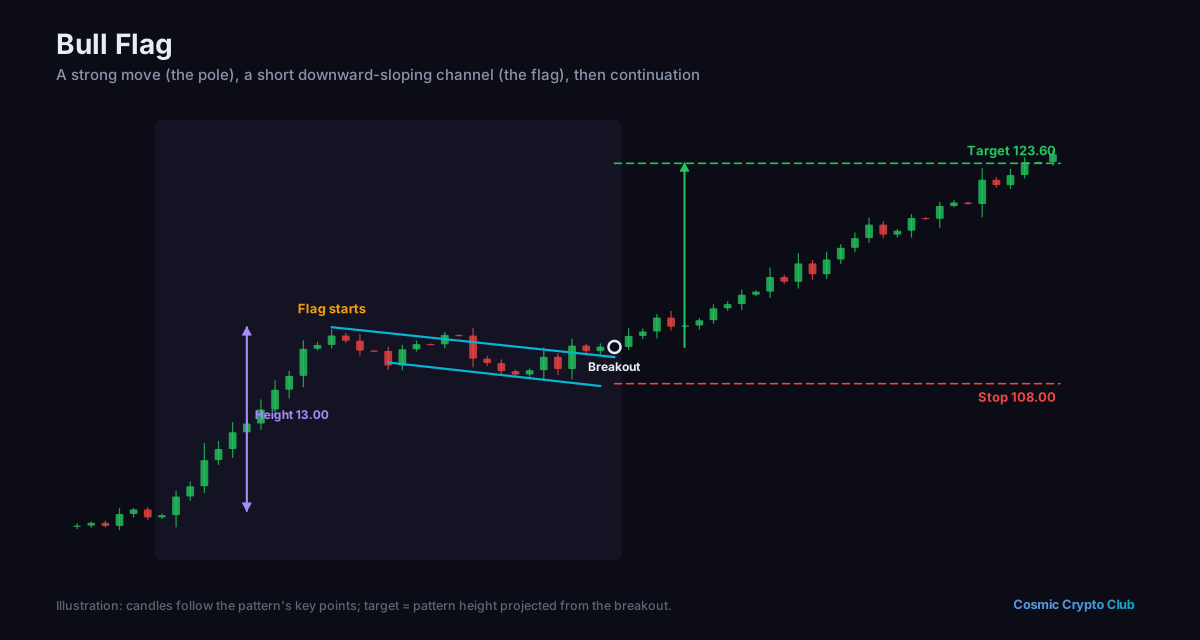
Example
“Bitcoin formed a textbook bull flag after rallying from $60,000 to $72,000, consolidating briefly near $69,000 before breaking out to new highs.”
Talk it through with other traders
Ask questions and discuss what you've learned in the Cosmic Crypto Club Discord. It's free, and so are the courses in the Hub with a Discord sign-in.