Risk ManagementM
Maximum Drawdown
Updated How we review
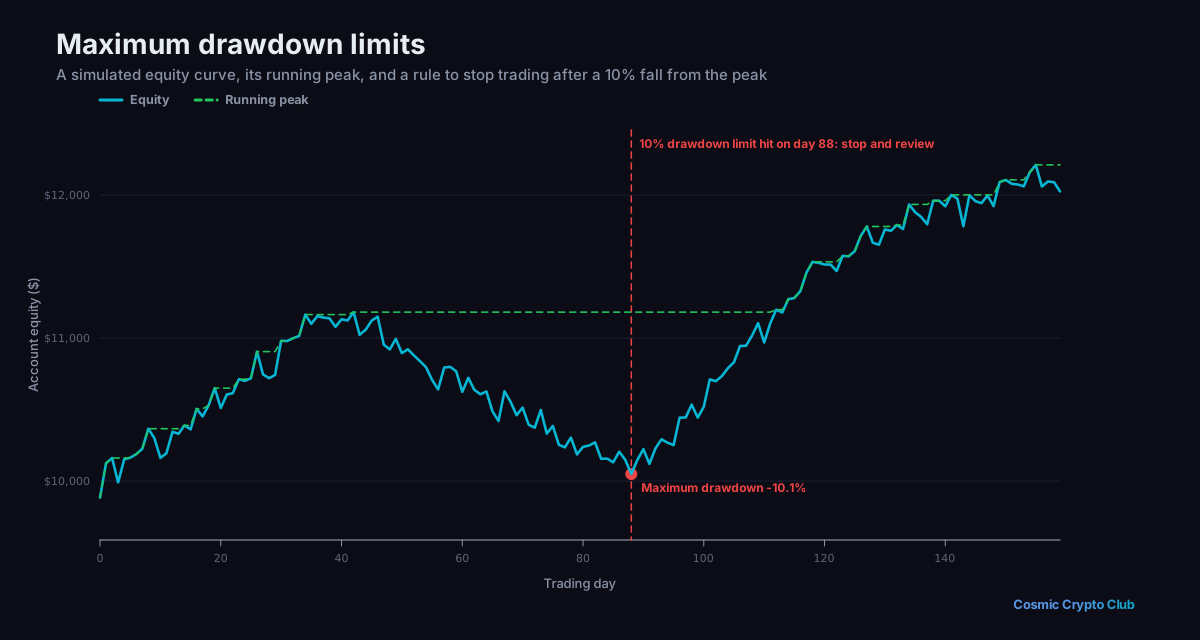
The largest peak-to-trough decline in the value of a portfolio or trading account before a new peak is reached. It measures the worst-case scenario an investor would have experienced and is a key metric for evaluating risk-adjusted performance of trading strategies.
Example
“A trading strategy had a maximum drawdown of 25%, meaning at its worst point, the account dropped from a peak of $100,000 to $75,000 before eventually recovering.”
Talk it through with other traders
Ask questions and discuss what you've learned in the Cosmic Crypto Club Discord. It's free, and so are the courses in the Hub with a Discord sign-in.