IndicatorsC
CCI
Updated How we review
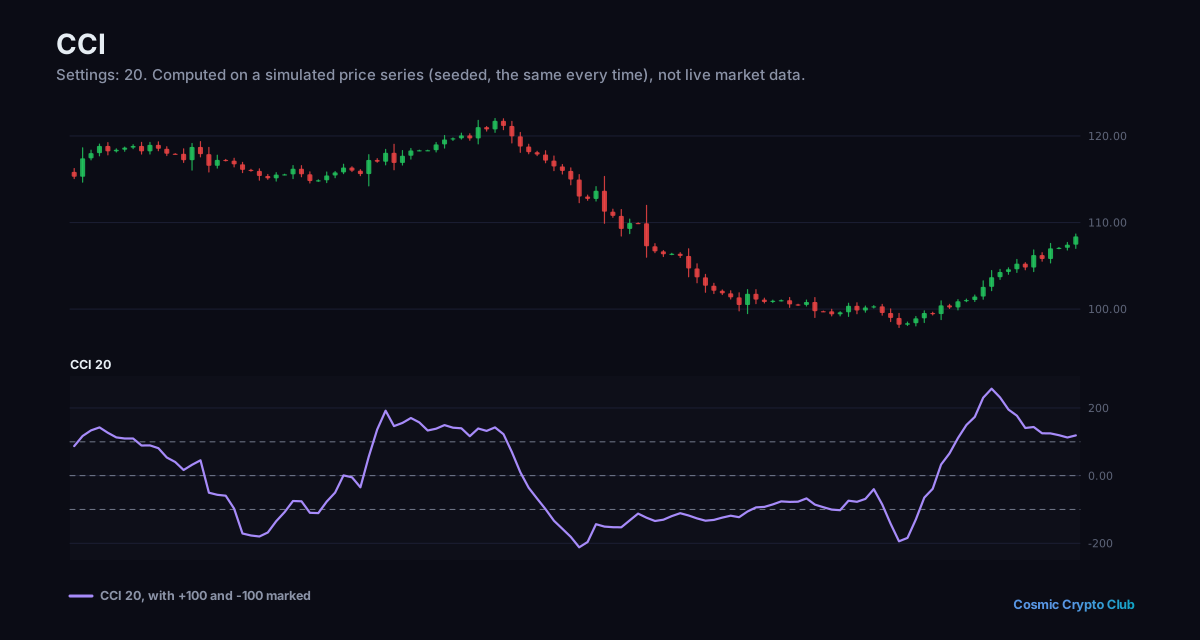
Commodity Channel Index — identifies cyclical trends in a security by measuring the difference between the current price and its statistical average. Values above +100 suggest overbought conditions, while readings below -100 indicate oversold territory. Traders use the CCI to spot potential reversals and confirm trend strength, making it a versatile tool across multiple timeframes and asset classes.
Example
“The CCI on the 4-hour chart dropped below -100, signaling oversold conditions and prompting traders to watch for a reversal pattern.”
Related Terms
Talk it through with other traders
Ask questions and discuss what you've learned in the Cosmic Crypto Club Discord. It's free, and so are the courses in the Hub with a Discord sign-in.