IndicatorsR
RSI
Updated How we review
Relative Strength Index — a momentum oscillator measuring the speed and magnitude of price movements on a scale of 0 to 100. Values above 70 are overbought; below 30 are oversold.
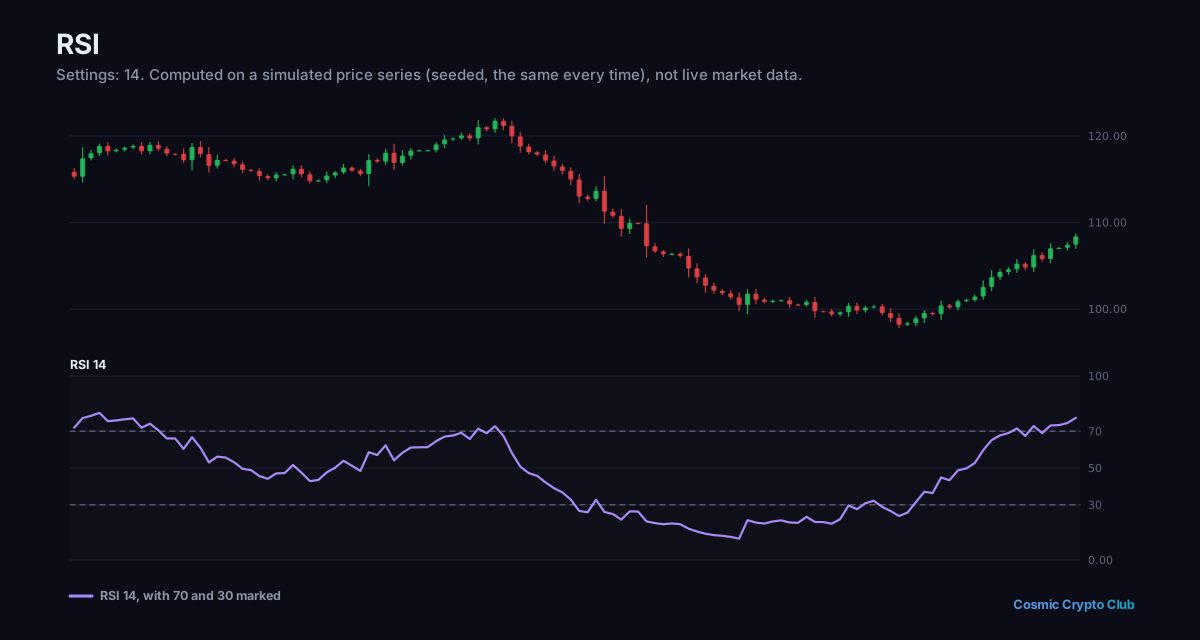
Example
“A trader checks the 14-period RSI on the daily BTC chart and sees it at 28, indicating oversold conditions, which prompts them to look for a bullish reversal entry.”
Full lesson
Related Terms
Talk it through with other traders
Ask questions and discuss what you've learned in the Cosmic Crypto Club Discord. It's free, and so are the courses in the Hub with a Discord sign-in.