IndicatorsM
MACD
Updated How we review
Moving Average Convergence Divergence — a trend-following momentum indicator showing the relationship between two moving averages of a security's price. Signals generated by crossovers and divergences.
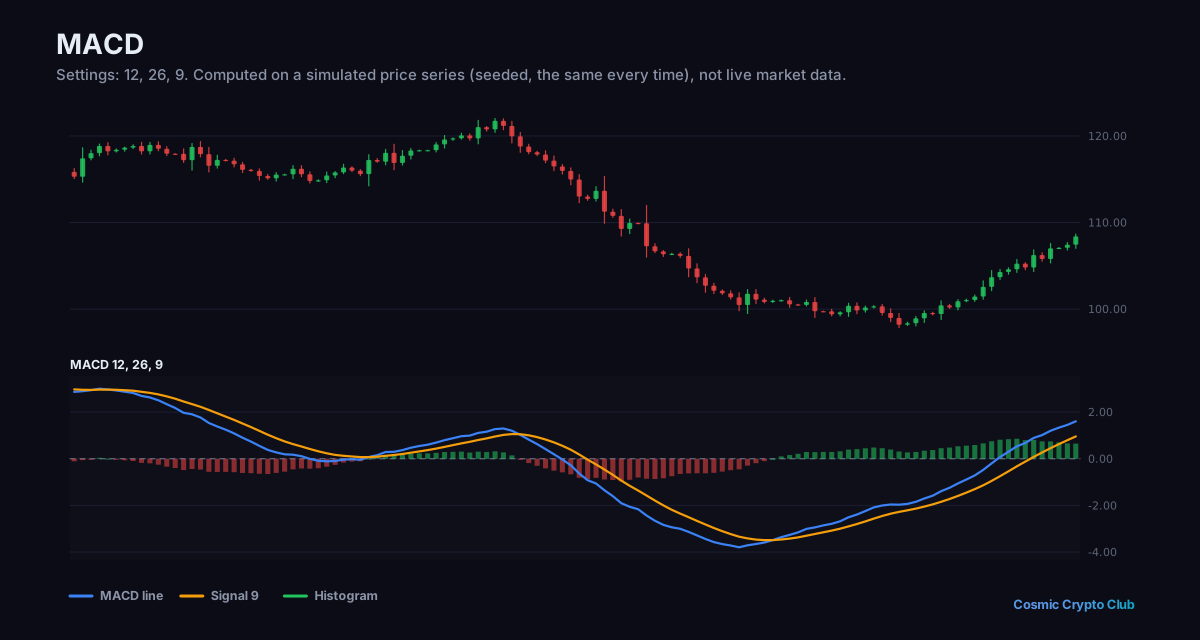
Example
“When the MACD line crossed above the signal line while the histogram turned positive, a trader entered a long position on ETH expecting bullish momentum to continue.”
Full lesson
Related Terms
Talk it through with other traders
Ask questions and discuss what you've learned in the Cosmic Crypto Club Discord. It's free, and so are the courses in the Hub with a Discord sign-in.