General TradingM
Momentum
Updated How we review
The rate of acceleration of a security's price or volume. In technical analysis, momentum measures the speed of price change and is used to identify the strength of a trend.
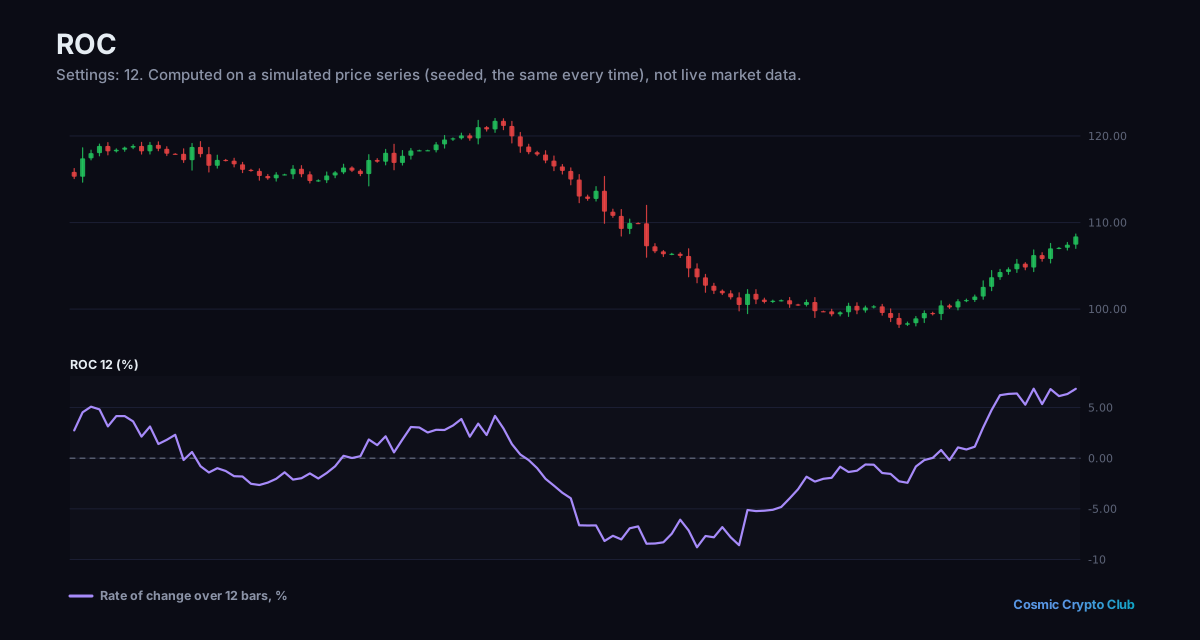
Example
“After Bitcoin broke above $50,000 with increasing volume, momentum indicators confirmed strong buying pressure, encouraging trend-following traders to add to their long positions.”
Talk it through with other traders
Ask questions and discuss what you've learned in the Cosmic Crypto Club Discord. It's free, and so are the courses in the Hub with a Discord sign-in.