General TradingG
Golden Cross
Updated How we review
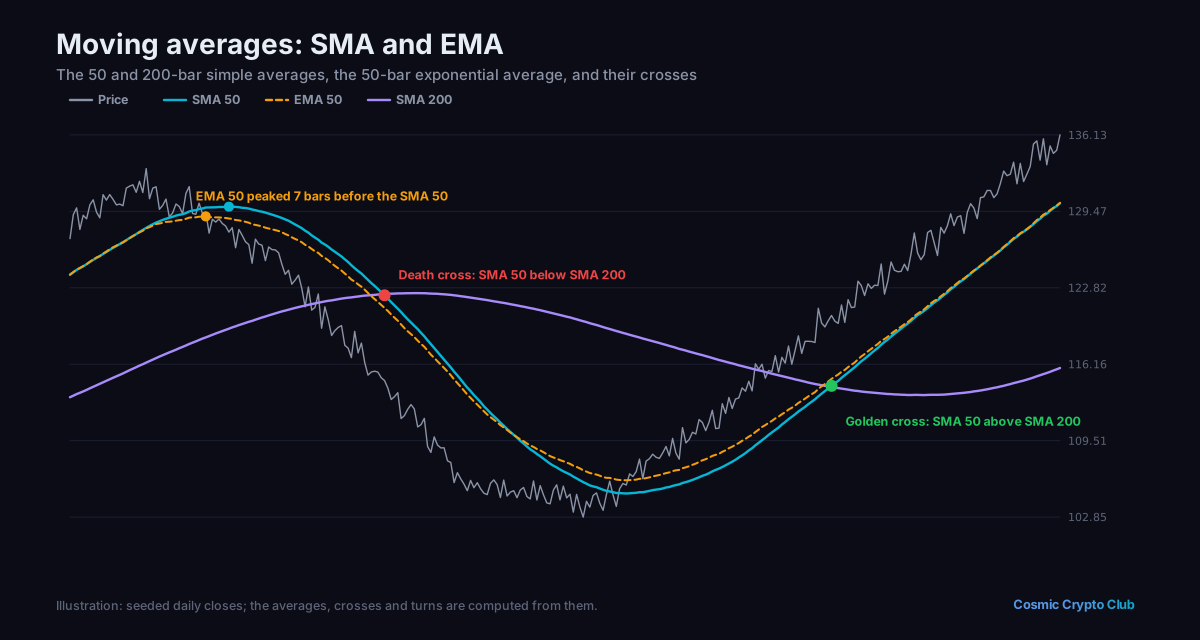
A golden cross is a bullish technical chart pattern where a shorter-term moving average crosses above a longer-term moving average, most commonly the 50-day moving average crossing above the 200-day moving average. It signals a potential shift from a bearish to a bullish trend and often attracts momentum buyers.
Example
“When Bitcoin's 50-day moving average crossed above its 200-day moving average forming a golden cross, technical traders interpreted it as a signal to enter long positions.”
Talk it through with other traders
Ask questions and discuss what you've learned in the Cosmic Crypto Club Discord. It's free, and so are the courses in the Hub with a Discord sign-in.