Chart PatternsH
Head and Shoulders
Updated How we review
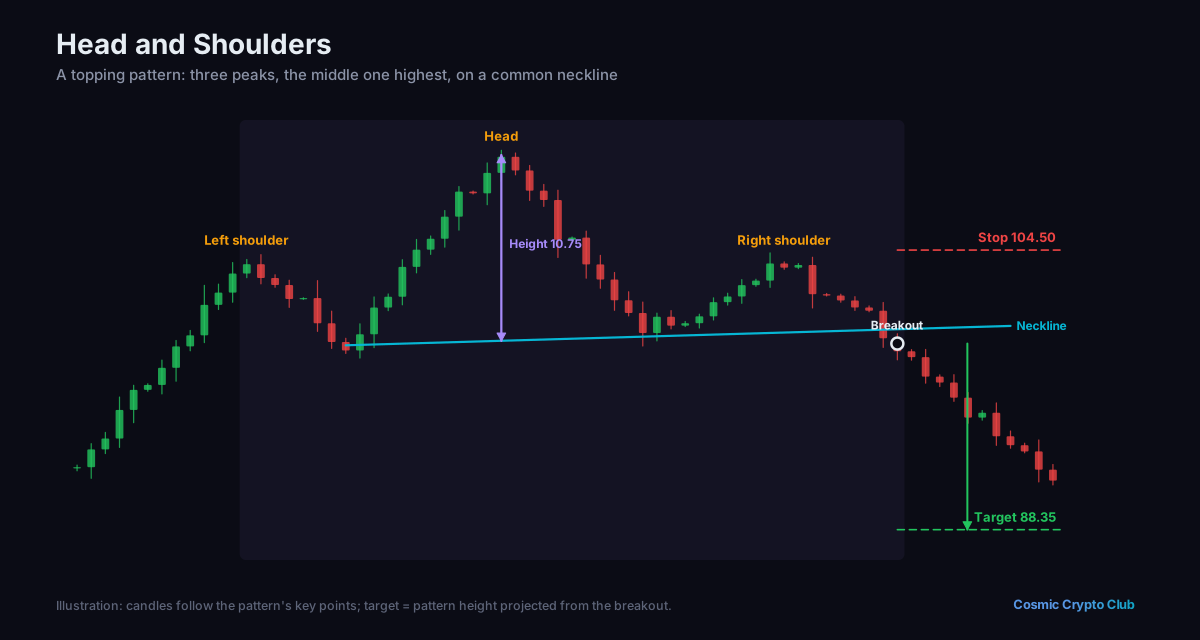
A bearish reversal pattern with three peaks — the middle peak (head) being the highest and the two outside peaks (shoulders) being lower and roughly equal.
Example
“BTC formed a head and shoulders pattern on the 4-hour chart with the neckline at $42,000. Once price broke below the neckline, traders shorted with a target equal to the pattern's height.”
Related Terms
Talk it through with other traders
Ask questions and discuss what you've learned in the Cosmic Crypto Club Discord. It's free, and so are the courses in the Hub with a Discord sign-in.