General TradingR
Rising Wedge
Updated How we review
A bearish chart pattern formed by two converging upward-sloping trendlines, where price makes higher highs and higher lows but with diminishing momentum. It typically signals a potential reversal to the downside.
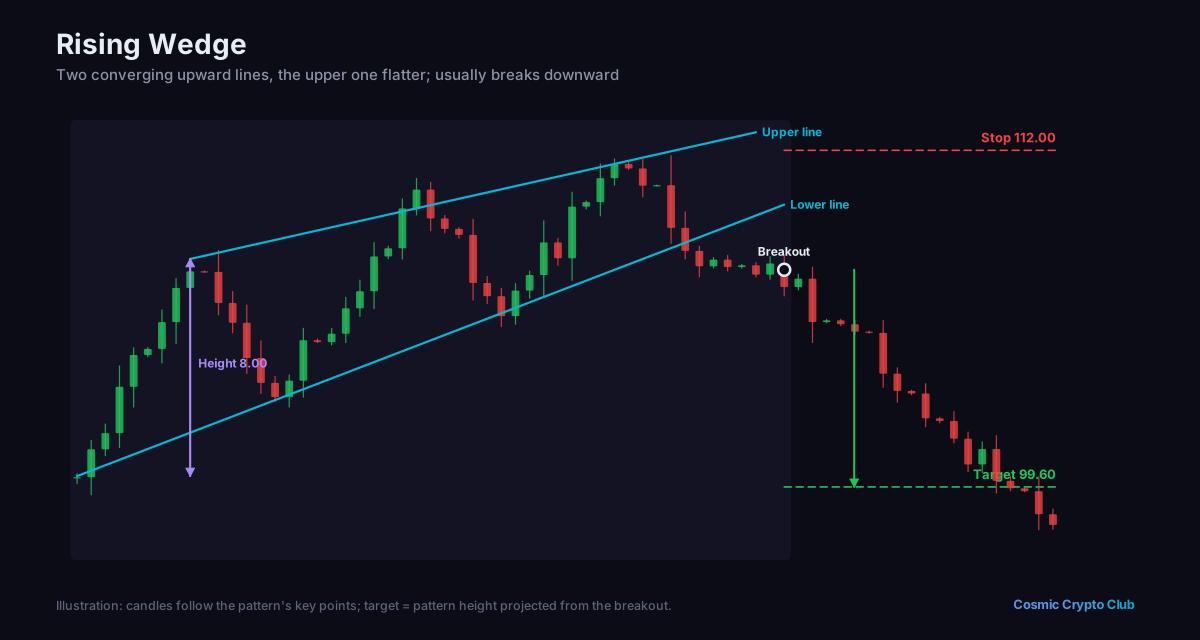
Example
“ETH formed a rising wedge over six weeks with shrinking volume, and when price broke below the lower trendline at $3,400, it cascaded down to $2,900 within days.”
Talk it through with other traders
Ask questions and discuss what you've learned in the Cosmic Crypto Club Discord. It's free, and so are the courses in the Hub with a Discord sign-in.