DCA (Dollar Cost Averaging) Calculator
Model a dollar-cost averaging plan: invest a fixed amount at regular intervals while the price moves in a straight line from a start price to an end price. See the units bought, your average cost and the result, next to putting the same total in at the start.
Total Invested
$5,200
Total Tokens
0.13293
Average Cost
$39,118.47
Current Value
$6,646.48
P/L ($)
$1,446.48
P/L (%)
27.82%
Lump Sum at Start
$8,666.67
0.173333 tokens
52 purchases over 1.0 years. Prices move in a straight line from the start price to the end price: a model, not market data.
How the DCA (Dollar Cost Averaging) calculator works
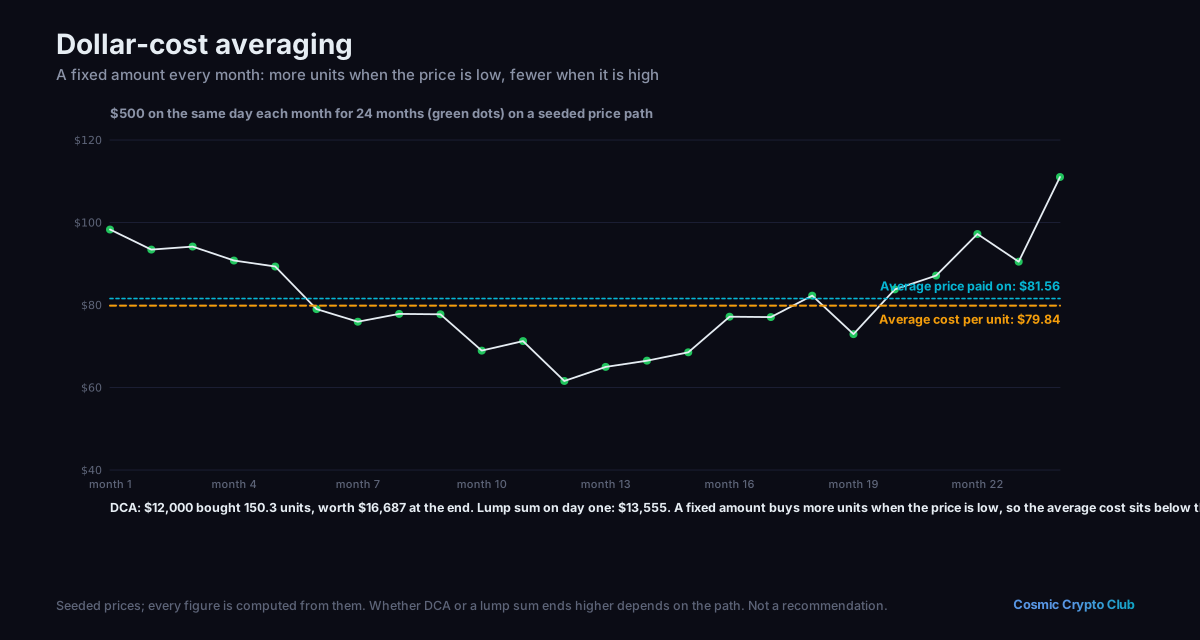
Dollar-cost averaging means investing the same amount at regular intervals whatever the price. The calculator spreads your purchases evenly along a straight line from the start price to the end price, adds up the units each purchase buys, and values them at the end price. It is a model of a price path you choose, not a test on past market prices.
Units bought = sum of (Investment per period / Price at each purchase)
Total invested = Investment per period x Number of periods
Average cost = Total invested / Units bought
Current value = Units bought x End price
P/L = Current value - Total invested
Worked example
You invest $100 five times while the price rises in equal steps from $100 to $200.
- Purchase prices: $100, $125, $150, $175 and $200.
- Units bought: 1 + 0.8 + 0.666667 + 0.571429 + 0.5 = 3.538095.
- Average cost: $500 / 3.538095 = $141.32.
- Current value: 3.538095 x $200 = $707.62.
- P/L: $707.62 - $500 = $207.62 (41.52%).
The $500 invested buys 3.538095 units at an average cost of $141.32, worth $707.62 at the end price.
Frequently asked questions
Why is my average cost lower than the average price?
A fixed dollar amount buys more units when the price is low and fewer when it is high, which pulls the average cost down. In the example the five prices average $150, but the average cost is $141.32.
Does this use real market prices?
No. It assumes the price moves in a straight line between the start and end prices you enter. Real prices move unevenly, so an actual plan over the same dates would give a different result.
How does this compare with investing everything at the start?
In the rising example, $500 invested at $100 buys 5 units worth $1,000, more than the plan's $707.62. If the price instead fell in a straight line from $200 to $100, the plan would end at $353.81 against $250 for the lump sum.
More Crypto & DeFi calculators
More tools in the Hub
Premium opens the Hub's Analytics section: market data, research, radars, screeners, macro, calculators and backtesting. The website and the Discord stay free.