IndicatorsI
Ichimoku Cloud
Updated How we review
A comprehensive technical indicator that defines support and resistance, identifies trend direction, gauges momentum, and provides trading signals. Consists of five lines forming a 'cloud'.
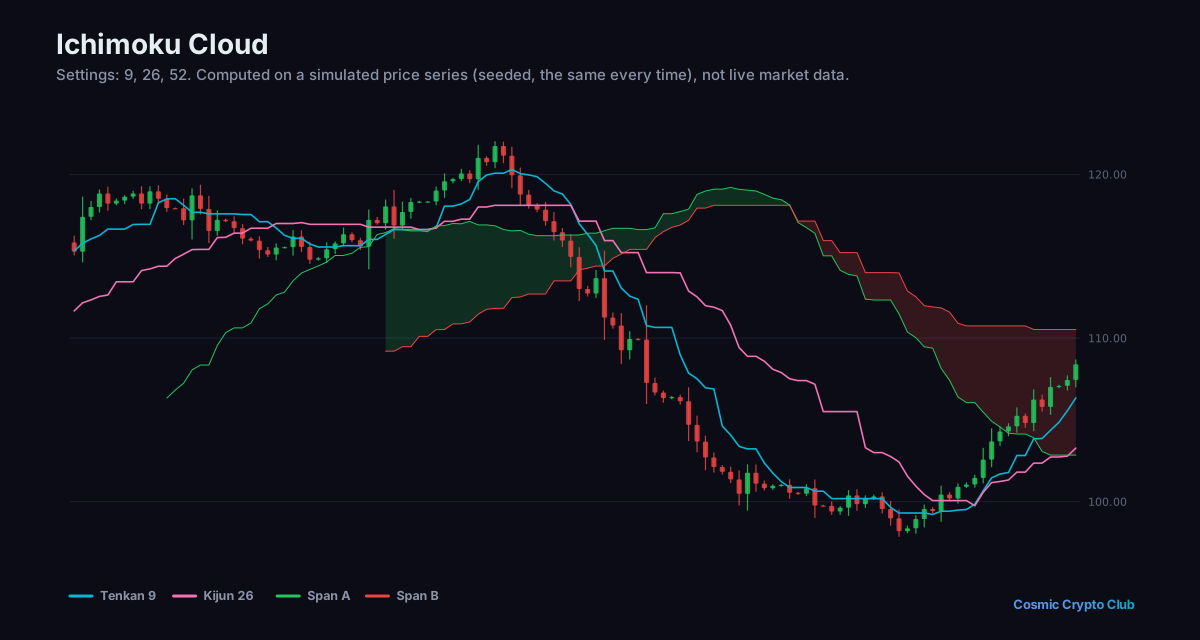
Example
“For example, when price breaks above the Ichimoku Cloud and the Tenkan-sen crosses above the Kijun-sen, traders interpret this as a strong bullish signal to enter a long position.”
Related Terms
Talk it through with other traders
Ask questions and discuss what you've learned in the Cosmic Crypto Club Discord. It's free, and so are the courses in the Hub with a Discord sign-in.