IndicatorsP
Parabolic SAR
Updated How we review
Stop and Reverse — a trend-following indicator providing potential entry and exit points. Dots above the price suggest a downtrend; dots below suggest an uptrend.
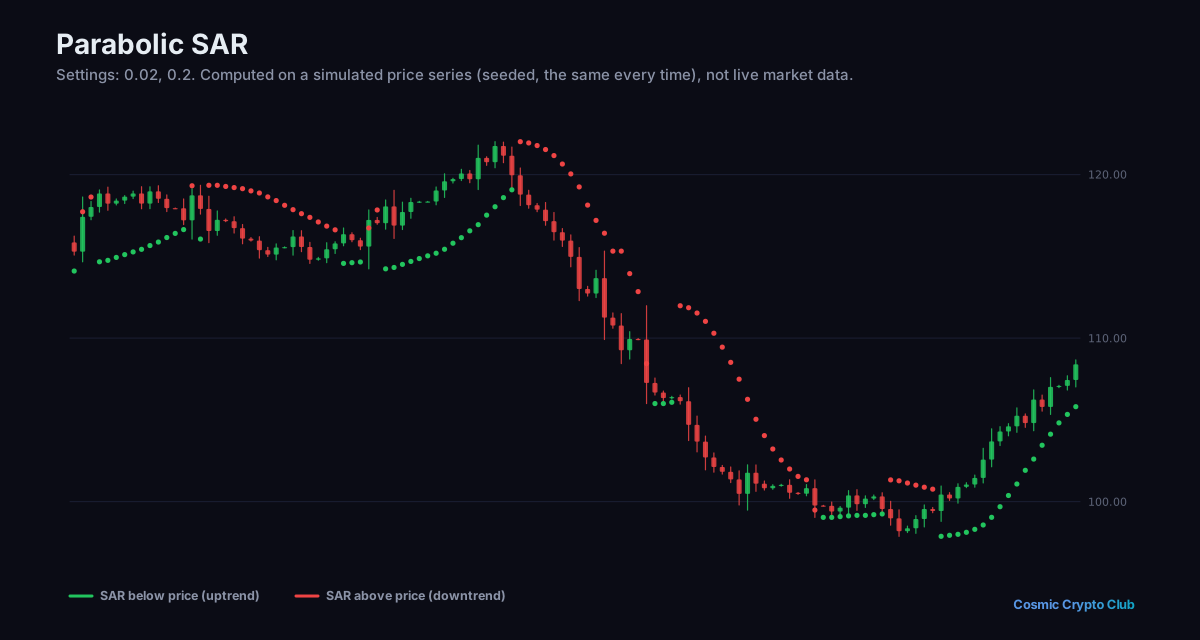
Example
“A swing trader exits their long position when the Parabolic SAR dots flip from below to above the price candles, signalling a potential trend reversal to the downside.”
Full lessons
Related Terms
Talk it through with other traders
Ask questions and discuss what you've learned in the Cosmic Crypto Club Discord. It's free, and so are the courses in the Hub with a Discord sign-in.