General TradingP
Pivot Points
Updated How we review
A set of support and resistance levels calculated from the previous period's high, low, and close. Traders use pivot points to identify potential turning points, entry points, and stop-loss levels.
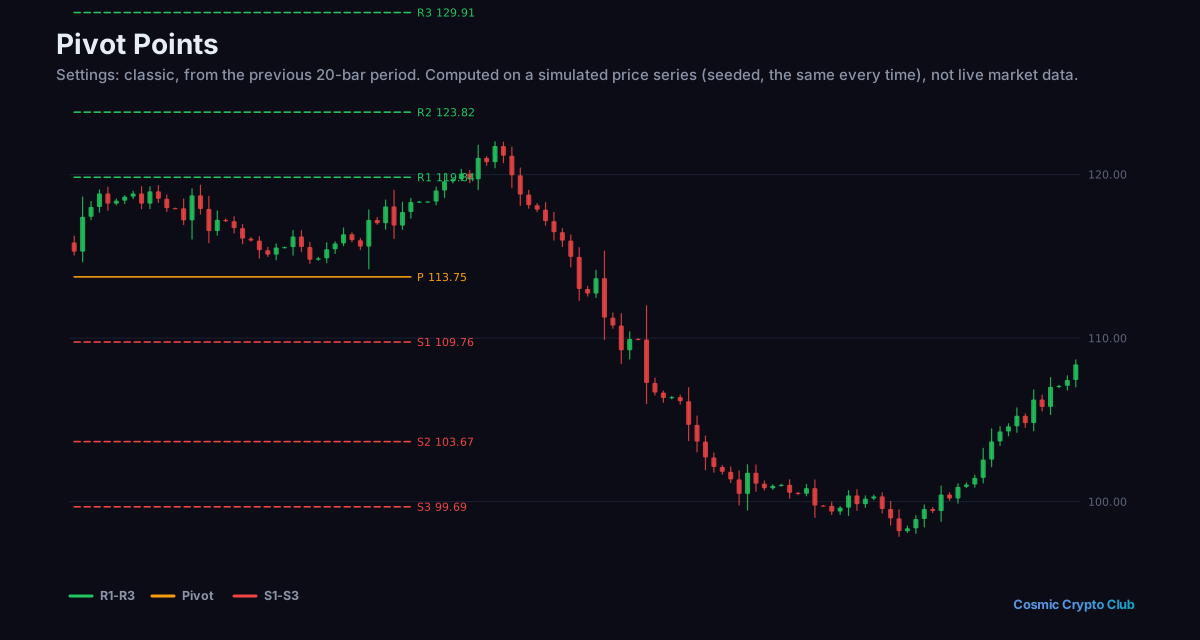
Example
“A day trader calculates the weekly pivot points and identifies R1 at $155 and S1 at $148, using these levels to set profit targets and stop losses.”
Full lesson
Talk it through with other traders
Ask questions and discuss what you've learned in the Cosmic Crypto Club Discord. It's free, and so are the courses in the Hub with a Discord sign-in.