Gann Angle Calculator
Calculate Gann angle-based price targets using high, low, and daily volatility. Project Gann fan lines to identify potential support and resistance levels.
| Angle | Ascending | Descending |
|---|---|---|
| 1x8 | 1.09800 | 1.10200 |
| 1x4 | 1.09400 | 1.10600 |
| 1x3 | 1.09300 | 1.10700 |
| 1x2 | 1.09200 | 1.10800 |
| 1x1 | 1.09100 | 1.10900 |
| 2x1 | 1.09050 | 1.10950 |
| 3x1 | 1.09033 | 1.10967 |
| 4x1 | 1.09025 | 1.10975 |
| 8x1 | 1.09013 | 1.10988 |
How the Gann Angle calculator works
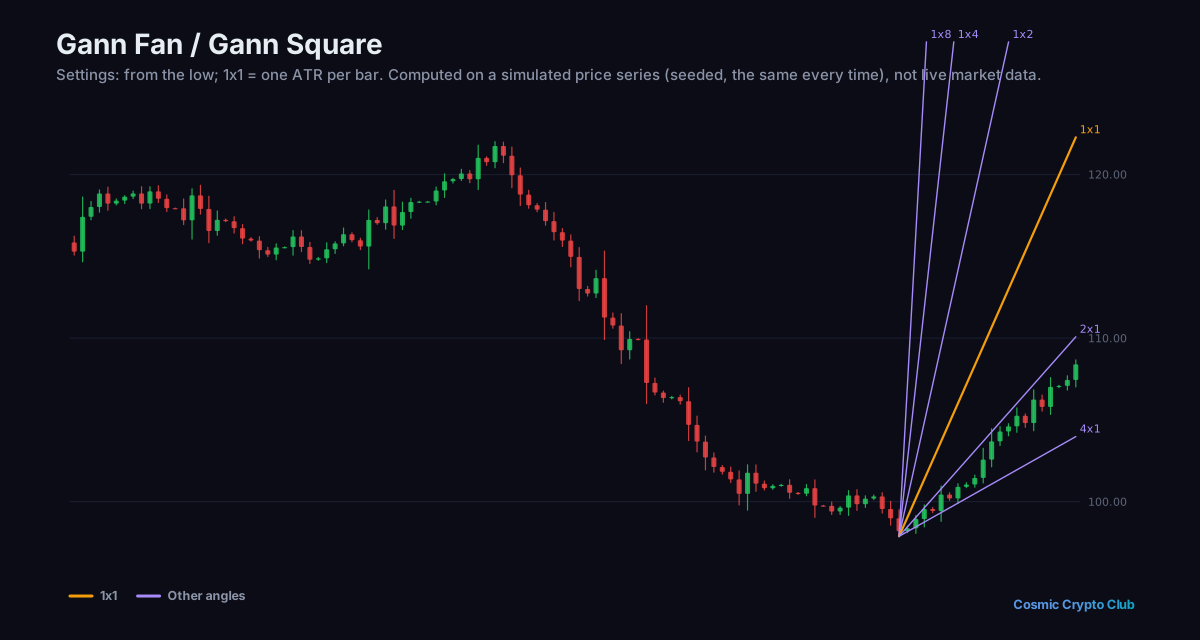
The calculator gives the price of each Gann angle a chosen number of bars after a pivot. Ascending lines start at the low and descending lines at the high. The 1x1 line moves one price unit per bar; the other lines move a multiple or a fraction of that, and the table shows where each line is after the number of bars entered.
Angle T x P moves P price units every T bars
Ascending level = Low + (P / T) x Price per bar x Bars
Descending level = High - (P / T) x Price per bar x Bars
Worked example
A share made a low of $100 and a high of $120; the 1x1 scale is $2 per bar and 5 bars have passed.
- 1x1 ascending: 100 + 1 x 2 x 5 = 110
- 1x2 ascending (two units per bar): 100 + 2 x 2 x 5 = 120
- 2x1 ascending (half a unit per bar): 100 + 0.5 x 2 x 5 = 105
- 1x1 descending: 120 - 1 x 2 x 5 = 110
The calculator shows the ascending 1x1 line at 110.00000, the 1x2 at 120.00000 and the 2x1 at 105.00000, with the descending 1x1 at 110.00000.
Frequently asked questions
What does 1x2 mean?
The first number is time and the second is price. A 1x2 line moves two price units for every bar, so it is steeper than the 1x1; a 2x1 line moves one price unit every two bars.
Why do I enter a price per bar?
A Gann angle is a rate of price change over time, so one unit of price has to be chosen for the chart. The 1x1 line rises by exactly that amount each bar and the other lines are multiples or fractions of it.
What are the angles in degrees?
On a chart scaled so that the 1x1 line is 45 degrees, the lines are 82.5 (1x8), 75 (1x4), 71.25 (1x3), 63.75 (1x2), 45 (1x1), 26.25 (2x1), 18.75 (3x1), 15 (4x1) and 7.5 degrees (8x1).
More Technical Calculators calculators
More tools in the Hub
Premium opens the Hub's Analytics section: market data, research, radars, screeners, macro, calculators and backtesting. The website and the Discord stay free.