Pivot Point Calculator
Calculate support and resistance pivot point levels using Floor, Woodie, Camarilla, DeMark, and Fibonacci methods from OHLC price data.
| Level | Floor | Woodie | Camarilla | DeMark | Fibonacci |
|---|---|---|---|---|---|
| R4 | - | - | 1.11600 | - | - |
| R3 | 1.13333 | 1.13500 | 1.11050 | - | 1.12167 |
| R2 | 1.12167 | 1.12250 | 1.10867 | - | 1.11403 |
| R1 | 1.11333 | 1.11500 | 1.10683 | 1.11750 | 1.10931 |
| PP | 1.10167 | 1.10250 | - | 1.10375 | 1.10167 |
| S1 | 1.09333 | 1.09500 | 1.10317 | 1.09750 | 1.09403 |
| S2 | 1.08167 | 1.08250 | 1.10133 | - | 1.08931 |
| S3 | 1.07333 | 1.07500 | 1.09950 | - | 1.08167 |
| S4 | - | - | 1.09400 | - | - |
How the Pivot Point calculator works
The calculator turns one bar's open, high, low and close into support and resistance levels for the next period, using five methods side by side. Floor and Fibonacci pivots start from the average of the high, low and close; Woodie counts the close twice; DeMark weights the high or the low depending on whether the bar closed above or below its open; Camarilla measures out from the close. Each method then adds and subtracts multiples of the high-low range.
Floor: PP = (H + L + C) / 3; R1 = 2 x PP - L; S1 = 2 x PP - H; R2 = PP + (H - L); S2 = PP - (H - L); R3 = H + 2 x (PP - L); S3 = L - 2 x (H - PP)
Woodie: PP = (H + L + 2 x C) / 4, then the same R and S formulas
Camarilla: C +/- (H - L) x 1.1 / 12, / 6, / 4 and / 2
DeMark: X = 2H + L + C if C > O; H + 2L + C if C < O; H + L + 2C if equal. PP = X / 4; R1 = X / 2 - L; S1 = X / 2 - H
Fibonacci: PP +/- 0.382, 0.618 and 1.000 x (H - L)
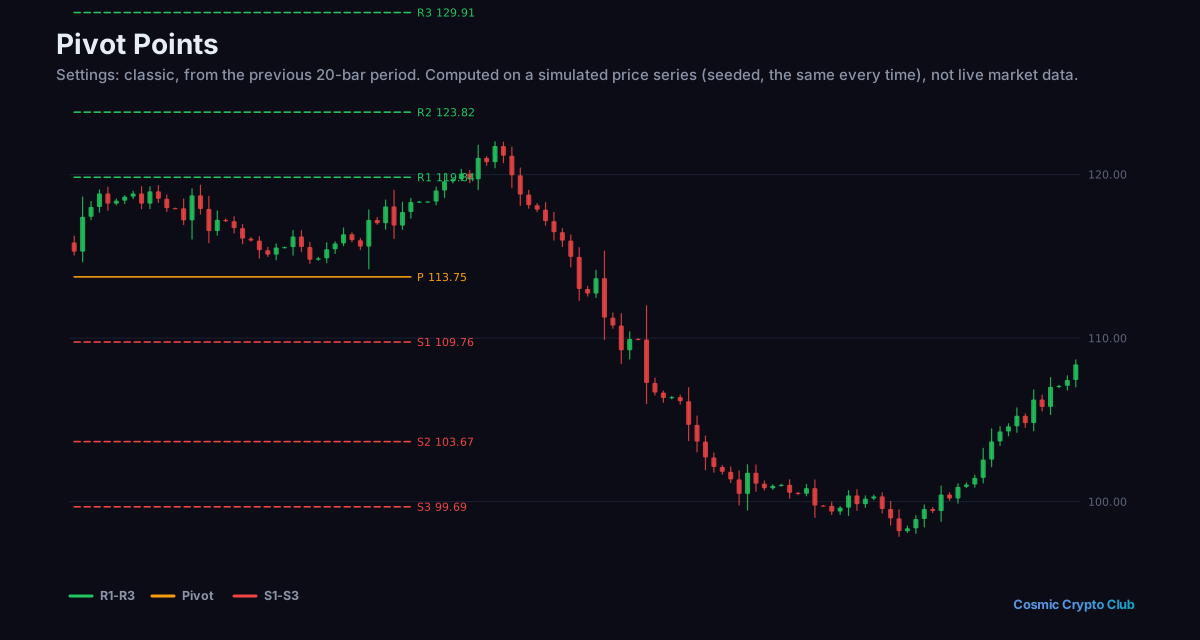
Worked example
Yesterday a share opened at $102, reached a high of $110 and a low of $100, and closed at $105.
- Floor pivot: (110 + 100 + 105) / 3 = 105
- Floor R1 and S1: 2 x 10⁵ - 100 = 110 and 2 x 10⁵ - 110 = 100
- Floor R2 and S2: 105 + 10 = 115 and 105 - 10 = 95
- Fibonacci R1: 105 + 0.382 x 10 = 108.82
- DeMark, close above open: X = 2 x 110 + 100 + 105 = 425; pivot = 425 / 4 = 106.25
The calculator shows a floor pivot of 105.00000 with R1 at 110.00000 and S1 at 100.00000, a Fibonacci R1 of 108.82000 and a DeMark pivot of 106.25000.
Frequently asked questions
Which prices do I enter?
The open, high, low and close of the period that has just finished, such as yesterday's daily bar. The levels then apply to the next period.
Why do the five methods give different levels?
Each weights the four prices differently. Floor and Fibonacci start from the average of high, low and close, Woodie counts the close twice, DeMark leans on the high or the low, and Camarilla measures from the close.
Why can the Woodie levels differ from a charting platform?
There are two versions of the Woodie pivot. This calculator uses the previous close; some platforms use the current session's open instead, which moves the levels when the market opens away from the previous close.
More Technical Calculators calculators
More tools in the Hub
Premium opens the Hub's Analytics section: market data, research, radars, screeners, macro, calculators and backtesting. The website and the Discord stay free.