Sharpe & Sortino Ratio Calculator
Paste a series of daily, weekly, monthly or yearly returns to get the annualised Sharpe and Sortino ratios, return, volatility and maximum drawdown.
Sharpe Ratio
0.75
Sortino Ratio
1.21
Returns Entered
12
Annualised Return
9.95%
Annualised Volatility
7.82%
Maximum Drawdown
-3.10%
Both ratios are annualised with the square root of the periods per year. Sortino only counts returns below the risk-free rate as risk. A short series gives a rough estimate: two or three years of monthly returns is a sensible minimum.
How the Sharpe & Sortino Ratio calculator works
The Sharpe ratio divides the average return above the risk-free rate by the volatility of those returns, so it shows how much return a strategy or fund earned for each unit of risk. The Sortino ratio uses the same average but divides by downside deviation, which counts only returns below the risk-free rate. Both are annualised from the returns you enter.
Risk-free rate per period rp = (1 + yearly rate)^(1 / N) - 1; N = periods a year
Sharpe = mean(r - rp) / standard deviation(r - rp) x sqrt(N)
Sortino = mean(r - rp) / downside deviation x sqrt(N)
Downside deviation = sqrt(sum of min(0, r - rp)^2 / number of returns)
Annualised return = (product of (1 + r))^(N / number of returns) - 1
Worked example
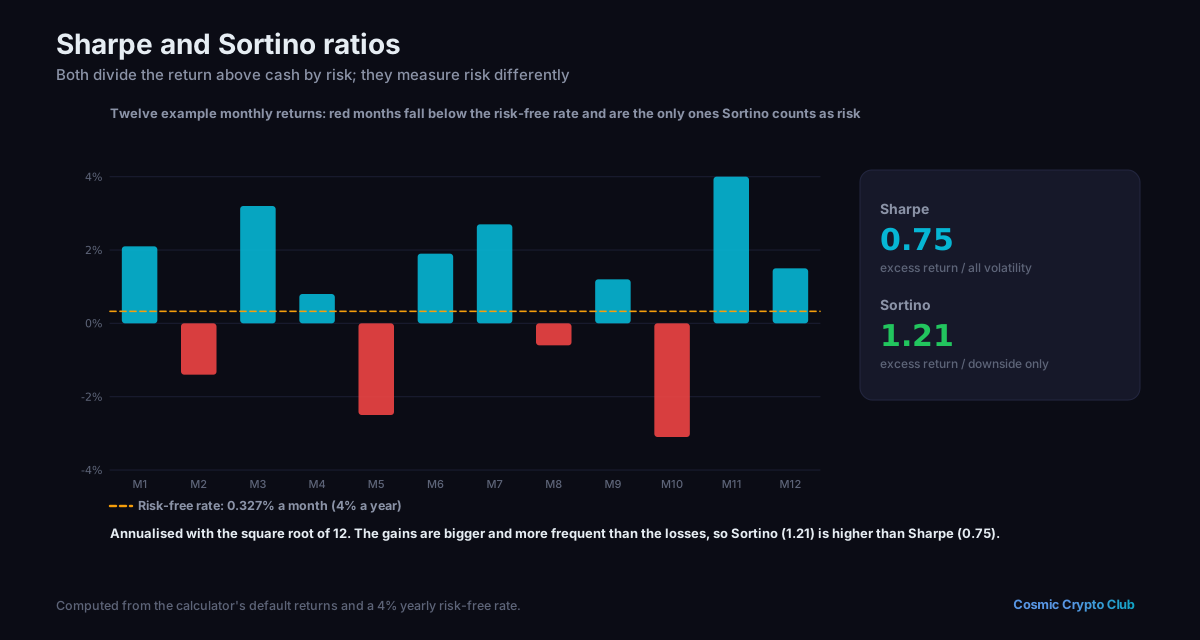
Twelve monthly returns (2.1%, -1.4%, 3.2%, 0.8%, -2.5%, 1.9%, 2.7%, -0.6%, 1.2%, -3.1%, 4%, 1.5%) and a risk-free rate of 4% a year.
- Monthly risk-free rate: 1.04^(1/12) - 1 = 0.3274%; average monthly excess return: 0.4893%.
- Standard deviation of the excess returns: 2.2574% a month. Sharpe: 0.4893 / 2.2574 x sqrt(12) = 0.75.
- Downside deviation: only the 4 months below the risk-free rate count (-1.4%, -2.5%, -0.6%, -3.1%), giving 1.4019%. Sortino: 0.4893 / 1.4019 x sqrt(12) = 1.21.
- Annualised return 9.95%, annualised volatility 7.82%, and the deepest fall from a peak was -3.10%.
A Sharpe ratio of 0.75 and a Sortino ratio of 1.21: the losing months were fewer and smaller than the winning ones, so Sortino scores the series higher.
Frequently asked questions
What is a good Sharpe ratio?
Above 1 is often described as good and above 2 as very good, but the number depends on the period, the market and how often returns are measured. Compare strategies or funds over the same period and with the same return frequency.
What is the difference between the Sharpe and Sortino ratios?
Sharpe treats all volatility as risk, including large gains. Sortino counts only returns below the risk-free rate, so a strategy whose volatility comes mostly from big winning periods scores better on Sortino than on Sharpe.
Why multiply by the square root of the periods per year?
Average returns grow in proportion to time, while volatility grows with the square root of time when returns are independent from one period to the next. Their ratio therefore grows with the square root of the number of periods.
How many returns do I need?
As many as you can get. A dozen returns gives a very rough estimate; two to three years of monthly returns, or a year or more of daily ones, is a more sensible minimum.
More Profit & Performance calculators
More tools in the Hub
Premium opens the Hub's Analytics section: market data, research, radars, screeners, macro, calculators and backtesting. The website and the Discord stay free.