Monte Carlo Simulation
Run a Monte Carlo simulation of your trading results: set win rate, reward multiple and risk per trade, and see the best, worst, average and median final balance across many random runs.
Best Case
$2,300.15
Worst Case
$1,035.54
Average
$1,644.09
Median
$1,582.31
Profitable Sims
100.0%
How the Monte Carlo Simulation works
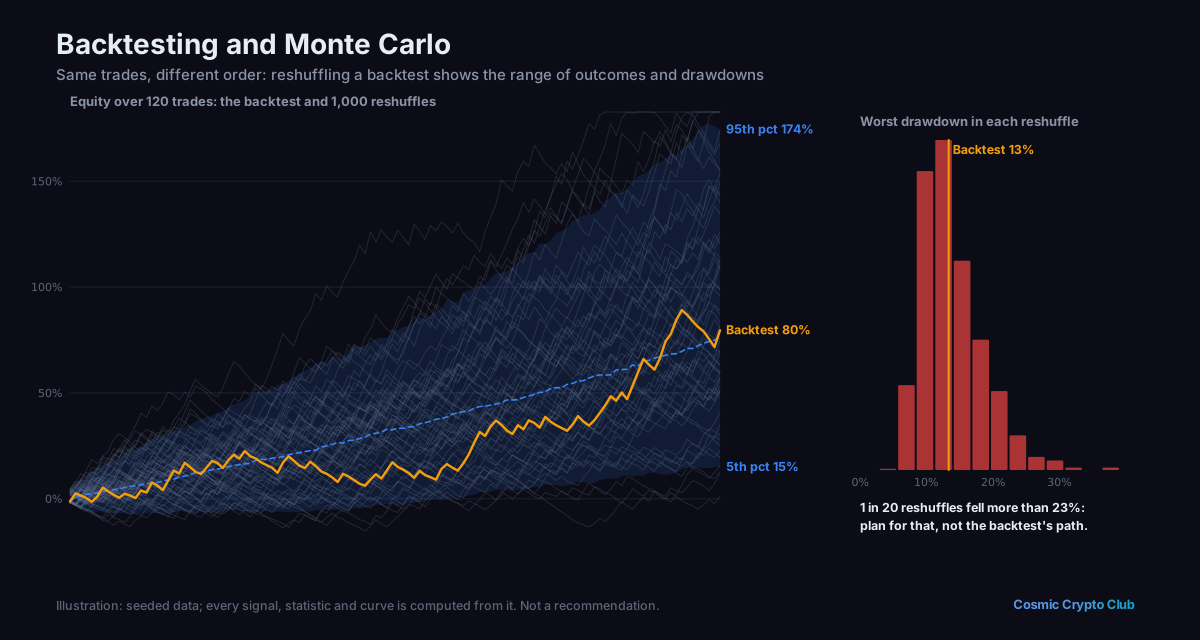
The simulator plays out your trading plan many times with random wins and losses. Each trade risks a fixed percentage of the current balance: a win adds that risk multiplied by your reward ratio, a loss takes the risk away. After the chosen number of trades it records the final balance of every run, then reports the highest, the lowest, the average, the median and the share of runs that ended in profit.
Win:  balance = balance + balance x risk % x reward multiple
Loss: balance = balance - balance x risk %
Expected average after N trades = capital x (1 + risk % x (win rate x reward multiple - loss rate))^N
Worked example
Start with $1,000, risk 1% per trade at a 1:1.5 reward ratio with a 50% win rate over 200 trades.
- A win on the first trade adds $1,000 x 1% x 1.5 = $15, so the balance is $1,015.
- A loss on the next trade takes 1% of $1,015 = $10.15, leaving $1,004.85.
- The average growth per trade is 50% x 1.015 + 50% x 0.99 = 1.0025.
- Over 200 trades the expected average is $1,000 x 1.0025^200 = $1,647.69.
- A run with exactly 100 wins and 100 losses ends at $1,000 x 1.015^100 x 0.99^100 = $1,622.27.
Across many runs the Average settles near $1,647.69 and the Median near $1,622.27, and about 99.7% of runs finish above $1,000; each run of the simulator lands close to these figures, not exactly on them.
Frequently asked questions
Why do the numbers change when I run it again?
Every run draws a new random sequence of wins and losses, so the results differ from one run to the next. More simulations bring the average and median closer to their long-run values.
Is the risk a percentage of my starting capital or my current balance?
It is a percentage of the current balance. The dollar amount at risk grows after wins and shrinks after losses, which is why the balance compounds.
Why is the average higher than the median?
Compounding makes the results lopsided: a few runs with many wins end very high and pull the average up. With the example inputs the expected average is $1,647.69 while the middle run ends near $1,622.27.
More Profit & Performance calculators
More tools in the Hub
Premium opens the Hub's Analytics section: market data, research, radars, screeners, macro, calculators and backtesting. The website and the Discord stay free.